You run a taxi business where bookings, driver assignments, completed trips, cancellations, fares, and payments generate operational data every day. But collecting that data is not the same as using it effectively.
Most operators collect data. Fewer turn it into decisions.
Without clear taxi analytics and reporting, it becomes difficult to answer basic operational questions. Which zones generate the most demand? Which drivers accept and complete the most trips? Why are passengers cancelling? Which vehicles are underused? And which booking channels produce the most revenue?
The right reports help you identify these patterns before they become expensive problems. They show where demand is growing, where dispatch performance is slowing down, where revenue is leaking, and where fleet resources are being wasted.
This blog explains the taxi KPIs every operator should monitor, the decisions those metrics support, and when spreadsheets stop being sufficient for a growing transport operation.
What Should Taxi Analytics and Reporting Track?
Every taxi business collects data. But not every business turns that data into decisions. That is where a reports and analytics tool for taxi businesses becomes your competitive advantage.
It helps you make sense of every trip, every fare, every zone, and every driver.
A useful reporting system does more than store numbers. It connects trip, driver, booking, fare, and vehicle data so you can understand what is happening and decide what needs attention.
Whether you run ten cars or one hundred, you need to know what is working and what is not.
What It Tracks and Why It Matters
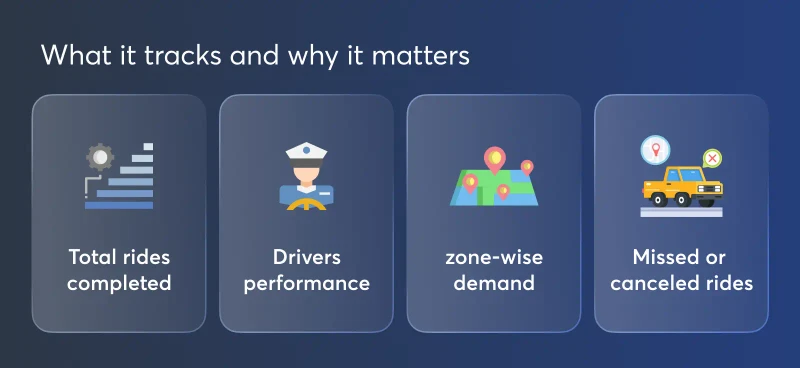
A smart ride hailing analytics tool goes far beyond basic reporting. It tracks:
-
Total rides completed
-
Booking sources and channel distribution
-
Driver performance and average ratings
-
Zone-wise demand and idle time
-
Revenue per vehicle and fuel efficiency
-
Missed or canceled rides with reasons
These numbers are not just for looking at. They help you answer critical questions like:
-
Which areas give you the most bookings?
-
Which drivers are losing you customers?
-
Are your marketing campaigns actually bringing results?
The right taxi dispatch analytics gives you the full picture and helps you act fast.
Taxi KPIs That Support Better Operational Decisions
Not every transport business needs the same reporting view. However, most taxi operators should monitor a core group of taxi performance metrics across demand, dispatch, drivers, cancellations, revenue, and fleet utilisation.
Booking Volume and Demand by Zone
Track the number of bookings generated by location, hour, day, and booking channel. This helps you identify high-demand zones with heatmaps, recurring demand periods, and areas where more drivers may be needed.
Zone-level demand data can also support better driver positioning and resource planning through taxi heat maps.
Trip Completion and Cancellation Rates
Compare completed, cancelled, rejected, and unassigned rides. Do not review the cancellation percentage alone. Track cancellation reasons, booking channels, locations, time periods, and the stage at which each cancellation occurred.
This helps you determine whether cancellations are linked to long waiting times, fare concerns, unavailable drivers, booking errors, or passenger behaviour.
Dispatch and Pickup Performance
Monitor the time between booking creation, driver assignment, driver acceptance, and passenger pickup. These metrics show whether your automated dispatching process is allocating rides efficiently or whether specific zones and time periods require intervention.
Driver Acceptance and Completion Rates
Track how frequently each driver accepts, rejects, cancels, and completes assigned trips. Driver performance monitoring can reveal inconsistent acceptance behaviour, excessive cancellations, low ratings, long response times, or uneven trip distribution.
Driver And Vehicle Utilisation
Measure active hours, idle time, completed trips, distance travelled, and revenue generated per driver or vehicle. Fleet management reports help you identify underused vehicles, overloaded drivers, inefficient shifts, and capacity gaps.
Revenue and Fare Performance
Review total revenue, average fare, revenue per trip, revenue per driver, revenue per vehicle, payment method, discount usage, and zone-level earnings. Fare management reports can also help identify pricing inconsistencies, low-margin routes, and repeated fare adjustments.
Booking Channel Performance
Compare bookings from passenger apps, web booking, phone calls, corporate portals, WhatsApp, email, kiosks, and partners. This shows which channels produce completed rides, repeat passengers, higher-value bookings, or unnecessary manual work.
Corporate Account Performance
Corporate operators should track trips by account, department, employee, cost centre, billing period, and invoice status. Corporate account management reports make it easier to identify account usage, unpaid invoices, booking trends, and contract profitability.
Customer Retention and Repeat Bookings
Measure new and returning passengers, booking frequency, average customer value, cancellation behaviour, and preferred booking channels. These metrics help operators understand whether passengers are returning or using the service only once.
The purpose of these KPIs is not to create more charts. Each metric should help you make a specific decision about dispatching, driver management, pricing, fleet capacity, customer retention, or account performance.
Free Taxi Analytics Tools: What They Offer and Where They Fall Short
Most small and mid-sized taxi operators begin with free taxi analytics tools. That makes sense in the early days. Tools like Google Sheets, Excel, or even Google Data Studio give you basic reporting options. They let you create charts, organize trip data, and maybe even generate weekly summaries.
Spreadsheets and general analytics tools can be useful when your fleet is small, your reporting needs are limited, and someone can maintain the data consistently.
The problems begin when bookings come from multiple channels, reports depend on manual exports, and different teams need current information.
At that stage, spreadsheet errors, delayed updates, disconnected data, and inconsistent report formats make it harder to trust the numbers.
When Spreadsheets and Generic Analytics Tools Stop Being Enough
Let’s take a closer look at some popular free tools many operators use:
-
Google Sheets or Excel: Great for organizing rows and columns but needs constant updating
-
Google Data Studio: Good for visuals, but depends on correct data input and lacks real-time capability
-
Zoho Analytics: Offers templates but often requires technical setup and lacks dispatch integration
Spreadsheets usually stop being sufficient when reports require frequent manual exports, driver and trip data sit in separate systems, multiple people edit the same files, or managers cannot access current information without asking someone to prepare it.
Those are signs that reporting has become an operational bottleneck rather than a decision-making tool.
These tools may show what happened yesterday. They do not help you act today.
The Problem with Generic Dashboards in a Taxi Business
Free tools cannot handle the complexity of ride hailing or taxi dispatch operations. They miss:
-
Real-time data from driver apps and dispatch
-
Custom KPIs like average pickup time or zone-wise revenue
-
Role-based access for dispatchers, managers, or corporate clients
-
Automated reporting for corporate billing or airport schedules
Using a free taxi analytics tool is like using a flashlight when you need headlights. It helps a little but does not light the road ahead.
Turn Operational Data Into Reports You Can Use
See how Yelowsoft turns trip, driver, zone, and revenue data into operational reports.
Explore Yelowsoft Reporting
Now that we understand the limitations of free tools, let’s see how a built-in analytics dashboard like the one Yelowsoft offers changes the game.
Built-In Analytics with Yelowsoft: What Makes It Different
A built-in taxi reporting software connects data directly from bookings, dispatch activity, driver applications, trip records, zones, fares, payments, and corporate accounts.
Yelowsoft brings these operational data points into role-based reports so dispatchers, fleet managers, administrators, and finance teams can review the metrics relevant to their responsibilities.
The main advantage is not simply having more charts. It is reducing manual exports and giving teams a consistent view of the same operational information.
Real Time Taxi Dispatch Analytics and Custom Views
With Yelowsoft, you are not working off yesterday’s data.
You get a real time taxi dispatch analytics system that pulls live updates from your bookings, driver app, customer app, and zone activity.
You can:
-
Monitor active rides as they happen
-
Track driver response time and pickup delays
-
View heatmaps of high-demand zones
-
Spot cancellations by reason in real time
-
Compare dispatchers’ efficiency with ride assignment history
And it gets better. Every user—admin, manager, dispatcher, or finance officer—can customize what they see.
You do not need to scroll through irrelevant data. Yelowsoft gives you custom views that match your role, your goal, and your workflow.
This is what modern fleet operators really need. And it is where free tools simply cannot keep up.
Let’s take it even deeper and break down how this applies to different types of operators.
Ride Hailing, Limo, Airport, and Corporate Reporting Use Cases
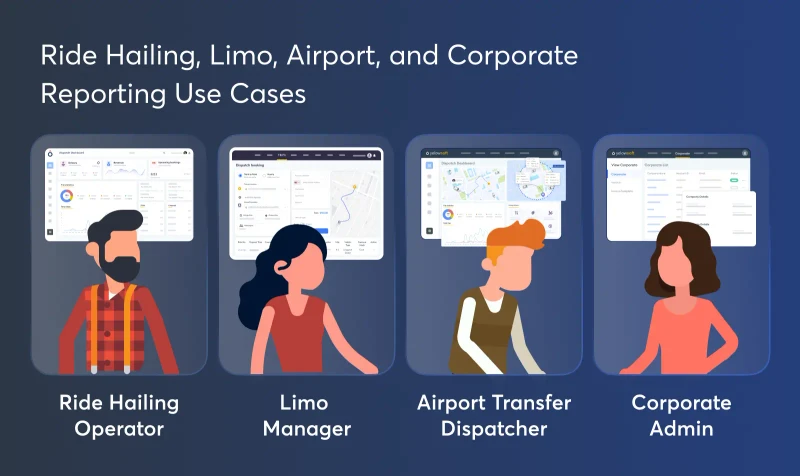
Yelowsoft’s ride hailing analytics tool is not one-size-fits-all.
It is built with the understanding that a limo operator has different needs than an airport transfer company, and a corporate taxi manager looks at data differently than a dispatcher.
Here is how the analytics adapt to each segment:
Ride-Hailing Analytics Tool: What Startups Get Wrong
Startups often rely on spreadsheets and patchy tools that track only basic numbers. But scaling a ride-hailing business means tracking things like:
-
Completed vs canceled rides
-
Driver acceptance rate
-
Time-to-dispatch per zone
-
New vs repeat passengers
-
Revenue per driver per shift
Yelowsoft’s ride hailing analytics tool gives you these insights without writing formulas or building dashboards from scratch. You log in. You see the metrics. You make better decisions.
Limo Dispatch Analytics: VIP Metrics You Can’t Ignore
Limo businesses thrive on experience and service quality. That is why limo dispatch analytics with Yelowsoft focuses on:
-
Chauffeur ratings
-
Trip wait time
-
Vehicle usage across corporate accounts
-
Booking source trends (app, phone, corporate panel)
-
Ride distance vs value per client
With this data, you can identify high-value clients, monitor driver decorum, and maintain your premium service promise. This is not just analytics—it is brand protection.
Airport Taxi Transfer Analytics: Scheduled Ride Tracking in Real Time
Airport transfer operators cannot afford to be late. You are dealing with flight schedules, baggage delays, and fixed routes.
Yelowsoft’s airport taxi transfer analytics focuses on:
-
Booking window vs actual pickup time
-
Real-time flight-linked dispatch
-
Airport terminal-wise demand
-
Scheduled vs ad-hoc ride ratio
-
Drop-off compliance timeframes
This helps you stay on top of your game, manage resources better, and deliver timely service even in high-pressure environments.
Corporate Taxi Service Analytics: Role-Based Reports That Save Time
Corporate clients want data. They want to know how many rides were taken, by whom, for what purpose, and how much it cost.
Yelowsoft’s corporate taxi service analytics handles this effortlessly:
-
Automated billing summaries
-
Usage by department or staff ID
-
Time-bound ride reports (e.g., monthly usage)
-
Expense tracking for reimbursements
-
Invoicing history linked to trip data
This level of reporting builds trust, saves admin time, and makes you the preferred vendor for any corporate travel contract.
Now that you have seen how powerful built-in analytics can be, let’s put it side-by-side with free tools to see the real difference. The table in the next section will make things crystal clear.
Spreadsheet Reporting vs Yelowsoft Taxi Analytics – Feature-by-Feature Comparison
A spreadsheet may be sufficient for a small operator with limited booking volume and simple weekly reporting. A built-in dashboard becomes more useful when reports must combine live booking, dispatch, driver, fare, fleet, and account data.
The following comparison shows how the two approaches differ operationally.
Spreadsheet Reporting vs Yelowsoft Taxi Analytics
| Feature | Free Taxi Analytics Tool | Yelowsoft Built-In Dashboard |
|---|---|---|
| Real-Time Dispatch Data | No live updates | Live driver, ride, and zone data |
| Custom KPIs per Role | Manual setup needed | Role-based dashboards for each user |
| Driver Performance Tracking | Requires extra setup | Built-in reports on ratings, speed, idle time |
| Zone-Based Ride Trends | Requires advanced filtering | Pre-built heatmaps and demand graphs |
| Corporate Billing Reports | Not available | Auto-generated invoices and reports |
| Airport Ride Scheduling Analytics | Not supported | Linked to flight schedules and terminals |
| Mobile Compatibility | Spreadsheet limitations | Works across web, dispatcher, and mobile apps |
| Onboarding & Support | DIY setup | Guided onboarding and expert support |
The important difference is how the data is collected and maintained. Spreadsheet reporting depends heavily on exports, formulas, manual updates, and individual ownership.
Built-in reporting draws from operational records directly, reducing preparation time and giving teams more consistent information.
In the next section, I will show you how to make the most of a modern dashboard once you start using one. Let’s turn your data into decisions.
How to Get the Most From Your Taxi Analytics Dashboard
Having access to reports does not automatically improve performance. Operators need clear reporting responsibilities, consistent review schedules, and defined actions for each KPI.
The following practices help turn taxi analytics into operational decisions rather than passive dashboard data.
Review Different Reports at the Right Frequency
Not every report needs to be reviewed at the same time.
Dispatchers may need to monitor active rides, unassigned bookings, driver availability, and delays throughout the day. Operations managers can review cancellations, acceptance rates, pickup times, and driver utilisation daily or weekly.
Revenue, corporate account usage, fleet profitability, and customer retention reports are usually more useful when reviewed weekly or monthly. The reporting schedule should match how quickly the metric can change and who is responsible for acting on it.
Custom KPIs per Role
Your dispatcher does not need the same data as your accountant. Your fleet manager does not need what your corporate client needs. This is where Yelowsoft’s ride hailing analytics tool becomes more powerful — it lets each user track the metrics that matter to them.
Here are some examples:
-
Dispatchers: real-time ride assignments, average wait time, zone demand
-
Fleet managers: vehicle utilization, fuel consumption, maintenance alerts
-
Finance team: revenue per trip, payment method breakdown, commission reports
-
Corporate clients: department-wise trip logs, invoices, usage trends
Custom KPIs make your operations cleaner and your decisions faster. No more one-size-fits-all reports. Everyone gets exactly what they need.
Use Driver Reports to Identify Workload and Retention Risks
If your drivers are quitting often or your dispatchers are overwhelmed, the reason might be hidden in your data. With a strong taxi dispatch analytics system, you can spot early signs of fatigue, overwork, or unfair trip distribution.
Here is how analytics can help:
-
Monitor idle time vs active hours
-
Track trip distance and earnings ratio
-
Identify drivers with low ratings or high cancellation rates
-
Balance ride assignments across zones and time slots
These patterns can help managers investigate workload imbalance, uneven trip allocation, low earnings, or repeated performance issues before they affect service quality or driver retention.
Data That Drives Revenue-Backed Decisions
At the end of the day, numbers are only useful if they grow your business. A good reports and analytics tool for taxi businesses turns raw data into real opportunities.
Here is how:
-
Spot top-performing zones and increase marketing there
-
Identify underused vehicles and optimize dispatch
-
Track the most loyal customer types and create loyalty offers
-
Detect repeated cancellations and fix app or pricing issues
With this kind of clarity, you can stop guessing and start making confident, revenue-driven decisions.
In the next section, I will answer some common questions about using a ride hailing analytics tool in real operations. If you have ever wondered what to expect from a taxi dashboard, the answers are coming up.
Final Thoughts: Real Data Wins, Guesswork Costs
Running a taxi business without a smart reports and analytics tool for taxi businesses is like driving without a map.
You might reach your destination, but not without mistakes, delays, and wasted fuel.
Whether you are in ride hailing, limo transfers, airport pickups, or corporate taxi service, using real-time insights gives you control, clarity, and growth.
Guessing might work for a while, but data-backed decisions will take you further.
Turn Your Taxi Data Into Profitable Business Decisions With Yelowsoft
FAQs
Taxi operators should track booking volume, completion rates, cancellations, driver acceptance, pickup time, revenue, vehicle utilisation, zone demand, booking channels, and repeat customers.
Live dispatch metrics should be monitored throughout the day. Driver and cancellation reports can be reviewed weekly, while revenue, fleet, and account reports are usually reviewed monthly.
Spreadsheets may be enough for small fleets with simple reporting needs. They become inefficient when data requires frequent exports, manual updates, multiple sources, or real-time access.
Driver utilisation compares active trip time with available working time. Operators can also review completed rides, idle time, earnings, distance, acceptance rates, and shift productivity.
Review cancellations by reason, booking channel, zone, time, driver assignment stage, fare, and passenger wait time. This helps identify whether the issue is operational, technical, or customer-related.
Corporate operators need account usage, department and employee trip logs, cost-centre reports, invoice history, payment status, recurring bookings, cancellations, and account profitability reports.
Airport operators should monitor scheduled pickups, on-time performance, flight-related changes, driver waiting time, terminal demand, cancellations, no-shows, booking lead time, and partner bookings.
Live tracking shows the current location and status of drivers and trips. Reporting analyses historical and current operational data to identify trends, problems, and performance changes.
Taxi analytics software reveals assignment delays, driver rejection patterns, high-demand zones, long pickup times, and unassigned rides. Operators can use this data to adjust dispatch rules and driver positioning.
Yelowsoft’s taxi reporting and analytics software connects trip, driver, fleet, fare, zone, booking, and corporate account data into role-based operational reports for dispatch, management, finance, and business planning.